Key Seaside FL Real Estate Trends for Second-Home Buyers
February 12, 2026
February 12, 2026
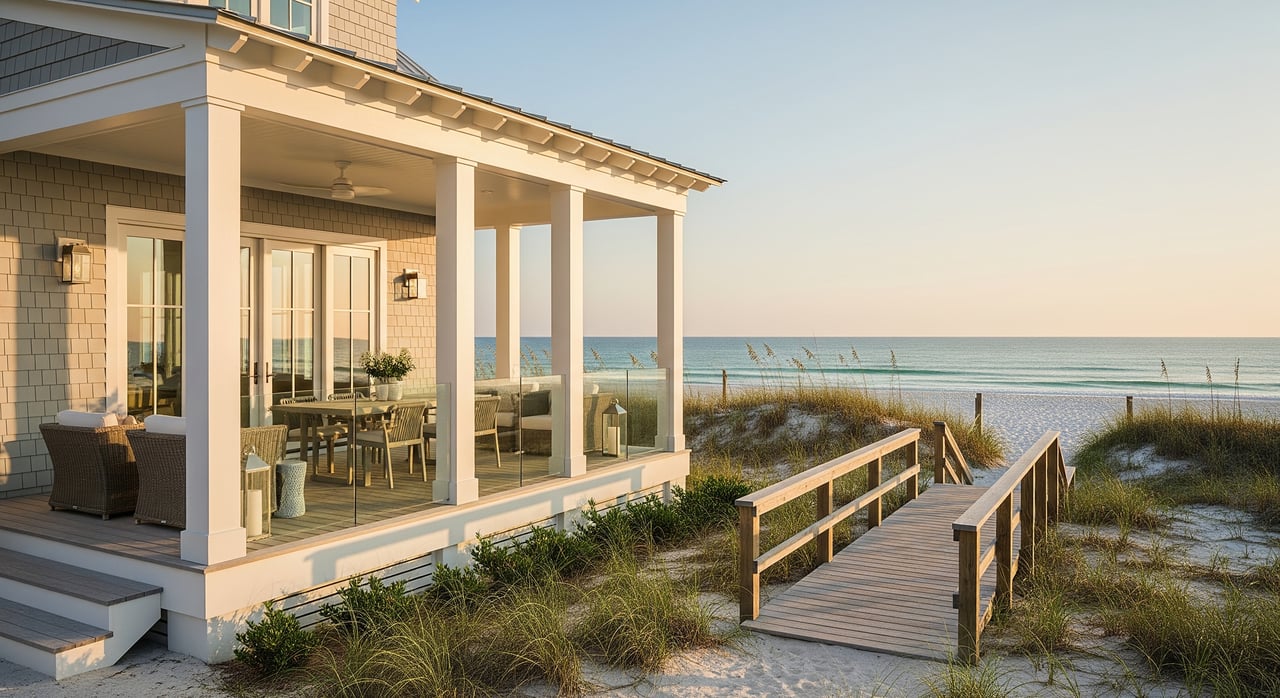
You come to Seaside for more than a shoreline. You come for the walkable town, the iconic cottages, and the feeling that everything you want is a short stroll away. If you are considering a second home here, you want to understand the patterns beneath the charm so you can buy with confidence. In this guide, you will learn which Seaside real estate trends matter most, how to read local market signals, and what to evaluate if you plan to enjoy rental income alongside personal use. Let’s dive in.
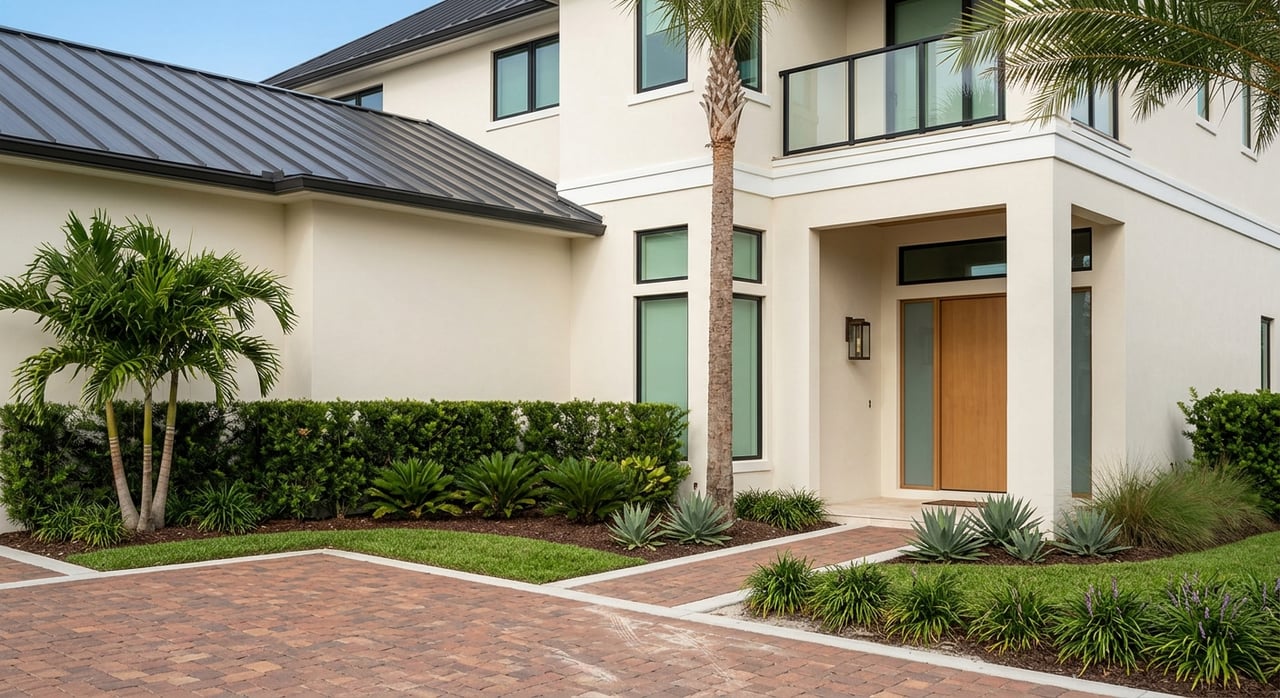
Seaside is a purpose-built, New Urbanist community on Scenic Highway 30A. Its tight-knit street grid, central square, and beach access create a lifestyle that drives strong demand. That design, paired with a cohesive architectural code, helps properties hold value and attract vacationers.
Walkability matters for both owners and guests. Homes close to the town center and the beach typically rent faster and resell at stronger price points. Cultural visibility also plays a role. Seaside’s reputation as an iconic 30A destination draws buyers who want a memorable place, not just a beachfront address.
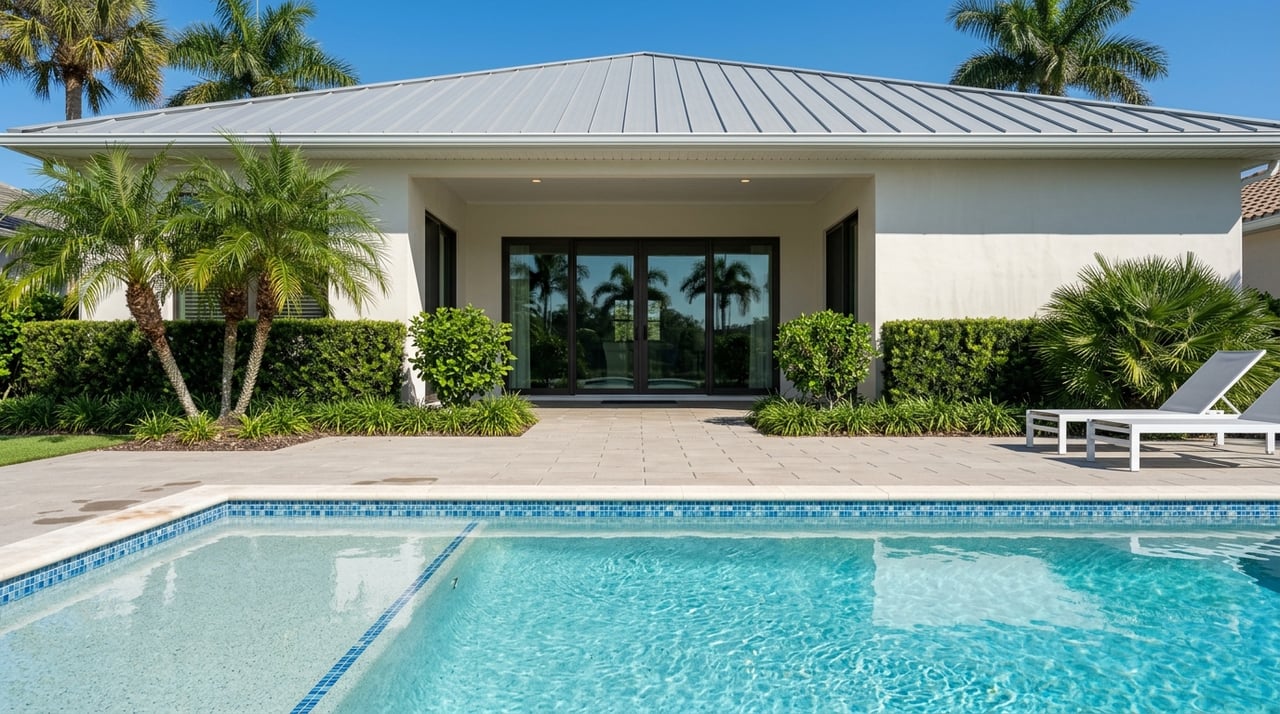
Where a home sits within Seaside is a major value driver. Beachfront properties with direct dune access or unobstructed Gulf views are in their own pricing tier. Even one or two blocks off the beach can create meaningful differences in price and rental performance. Elevated sites or homes with partial water views also see stronger demand.
When you review Seaside’s market data, focus on a small set of metrics and compare them over rolling windows. Because the neighborhood has limited inventory, a few sales can swing monthly numbers. Looking at 90-day or 12-month trends helps you see the true direction of the market.
Segment the market by property type and price band. Seaside often organizes into meaningful brackets like under 1 million dollars, 1 to 2.5 million dollars, 2.5 to 5 million dollars, and above 5 million dollars. Use these bands to compare the number of listings, median sale prices, days on market, and list-to-sale price ratios.
Compare price per square foot within the same property type and lot position. A beachfront cottage should not be stacked against an inland townhouse. Consistent apples-to-apples comparisons will give you a clearer view of value.
Vacation markets typically see a higher share of cash purchases than primary-home markets. If available in the MLS, tracking the percentage of cash transactions can give you a read on investor and second-home demand. It can also influence how you structure your offer.
Expect more new listings in spring and early summer. Because of this, look at rolling 90-day averages and 12-month views rather than single months. Seasonal swings are normal on 30A and can mask the underlying trend.
If you plan to rent your Seaside home when you are not using it, focus on what drives booking velocity and rates. Seaside’s walkability and branding create strong appeal across seasons, but performance still varies by property type, size, and presentation.
Demand typically peaks from late spring through summer, with additional surges during school breaks and key holidays. Fall and early spring can also perform well thanks to events and a mild climate. Plan occupancy and pricing around these rhythms, and budget for softer mid-winter weeks.
Every coastal home carries unique risks and costs. In Seaside, doing your homework upfront helps you avoid surprises and strengthens your offer.
Many properties sit in FEMA flood zones. If you finance, your lender may require flood insurance. Windstorm coverage is also a key factor on the Gulf. Ask about elevation certificates, impact windows, shutters, and other mitigation features that can help manage risk and premiums.
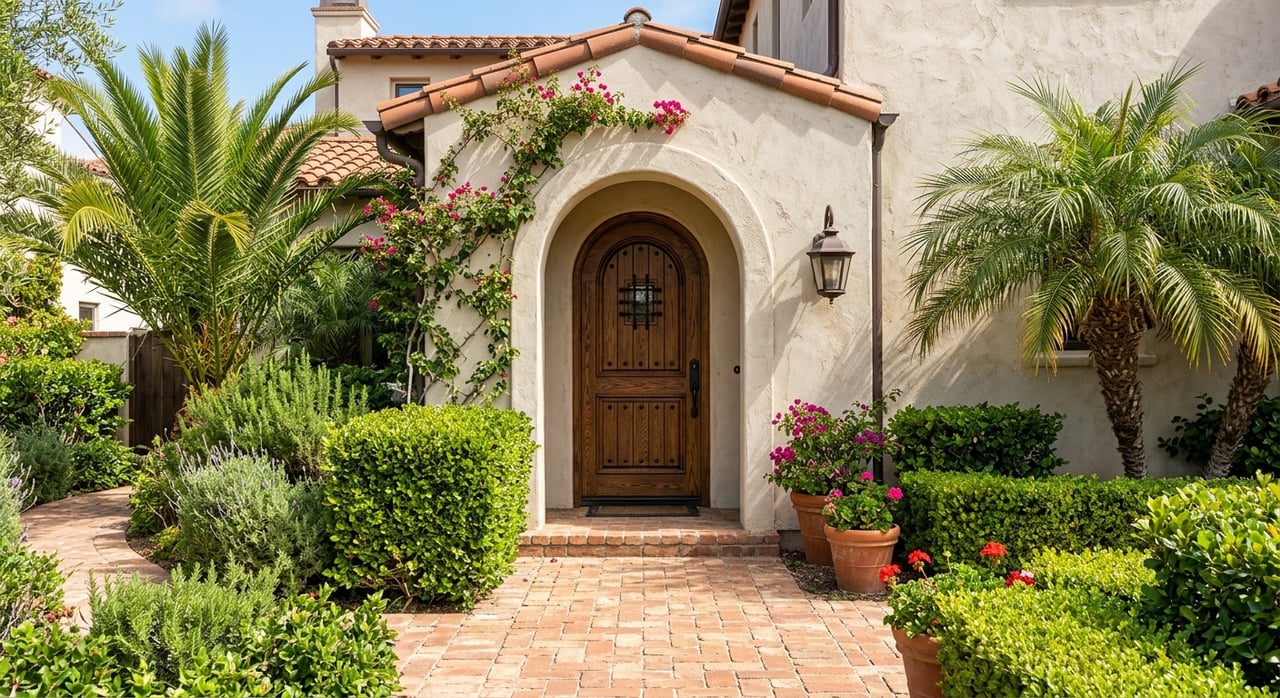
Seaside’s architectural covenants protect the community’s character and your long-term value. They also guide what you can change, from additions to exterior finishes. Review HOA budgets, reserves, and any short-term rental rules so you understand operating expectations and community standards.
Short-term rental owners should plan for property management fees, seasonal utility swings, routine maintenance, and guest turnover costs. High-demand resort areas often trade at lower cap rates because buyers value lifestyle and appreciation along with income. Align your expectations with realistic occupancy and expenses.
Inside Seaside, new supply is limited due to land scarcity, which supports long-term value. That said, track nearby building permits and projects along 30A. New infill or developer activity in adjacent communities can shift buyer attention and influence pricing across micro-markets.
To understand value, compare Seaside’s metrics with nearby communities like WaterColor, Alys Beach, and Rosemary Beach. Use head-to-head comparisons by property type and lot position. Look at price per square foot, days on market, and list-to-sale price ratios in each area. A home that is a top performer in one town may price differently two miles away due to design codes, amenities, and beach access patterns.
Build a rolling 90-day snapshot for Seaside using the MLS, then cross-check against a 12-month view to smooth seasonal noise.
Segment by property type and lot position. Focus your search on the streets or blocks that match your lifestyle and rental goals.
Identify your price band and watch new listings in that range. Track days on market and price reductions weekly.
Obtain insurance quotes early and confirm flood and wind requirements. Ask about mitigation features and potential premium impacts.
Review HOA covenants, rental guidelines, and budgets. Confirm any local registration or tax requirements for short-term rentals.
If you plan to rent, assemble a conservative pro forma with realistic occupancy, rates, and operating costs. Pressure test against shoulder season assumptions.
Time your offer strategy for seasonality. More spring listings can create options, while off-season periods can offer quieter negotiations.
When you align lifestyle goals with sound data, you give yourself room to enjoy Seaside today and protect value for tomorrow.
Ready to explore Seaside with local guidance and a turnkey rental strategy if you want it? Reach out to the Bellville Team for a private consultation and data-backed plan that fits your goals.
Experience a level of service that goes beyond transactions. Whether you’re buying, selling, or exploring short-term rentals, we’re here to offer personalized insights and exclusive local expertise. Let’s collaborate to unlock your dream lifestyle on Santa Rosa Beach—because every connection brings you one step closer to the home you deserve.